The Analytics page
Your revenue, activity, relationship health and promises in one place — every figure explained and linked to the records behind it.
Updated 13 Nov 2026
The Analytics page answers "how are we doing?" with numbers you can check. KretaOS counts every figure from your own records, explains how it was counted, and lets you open the records behind it.
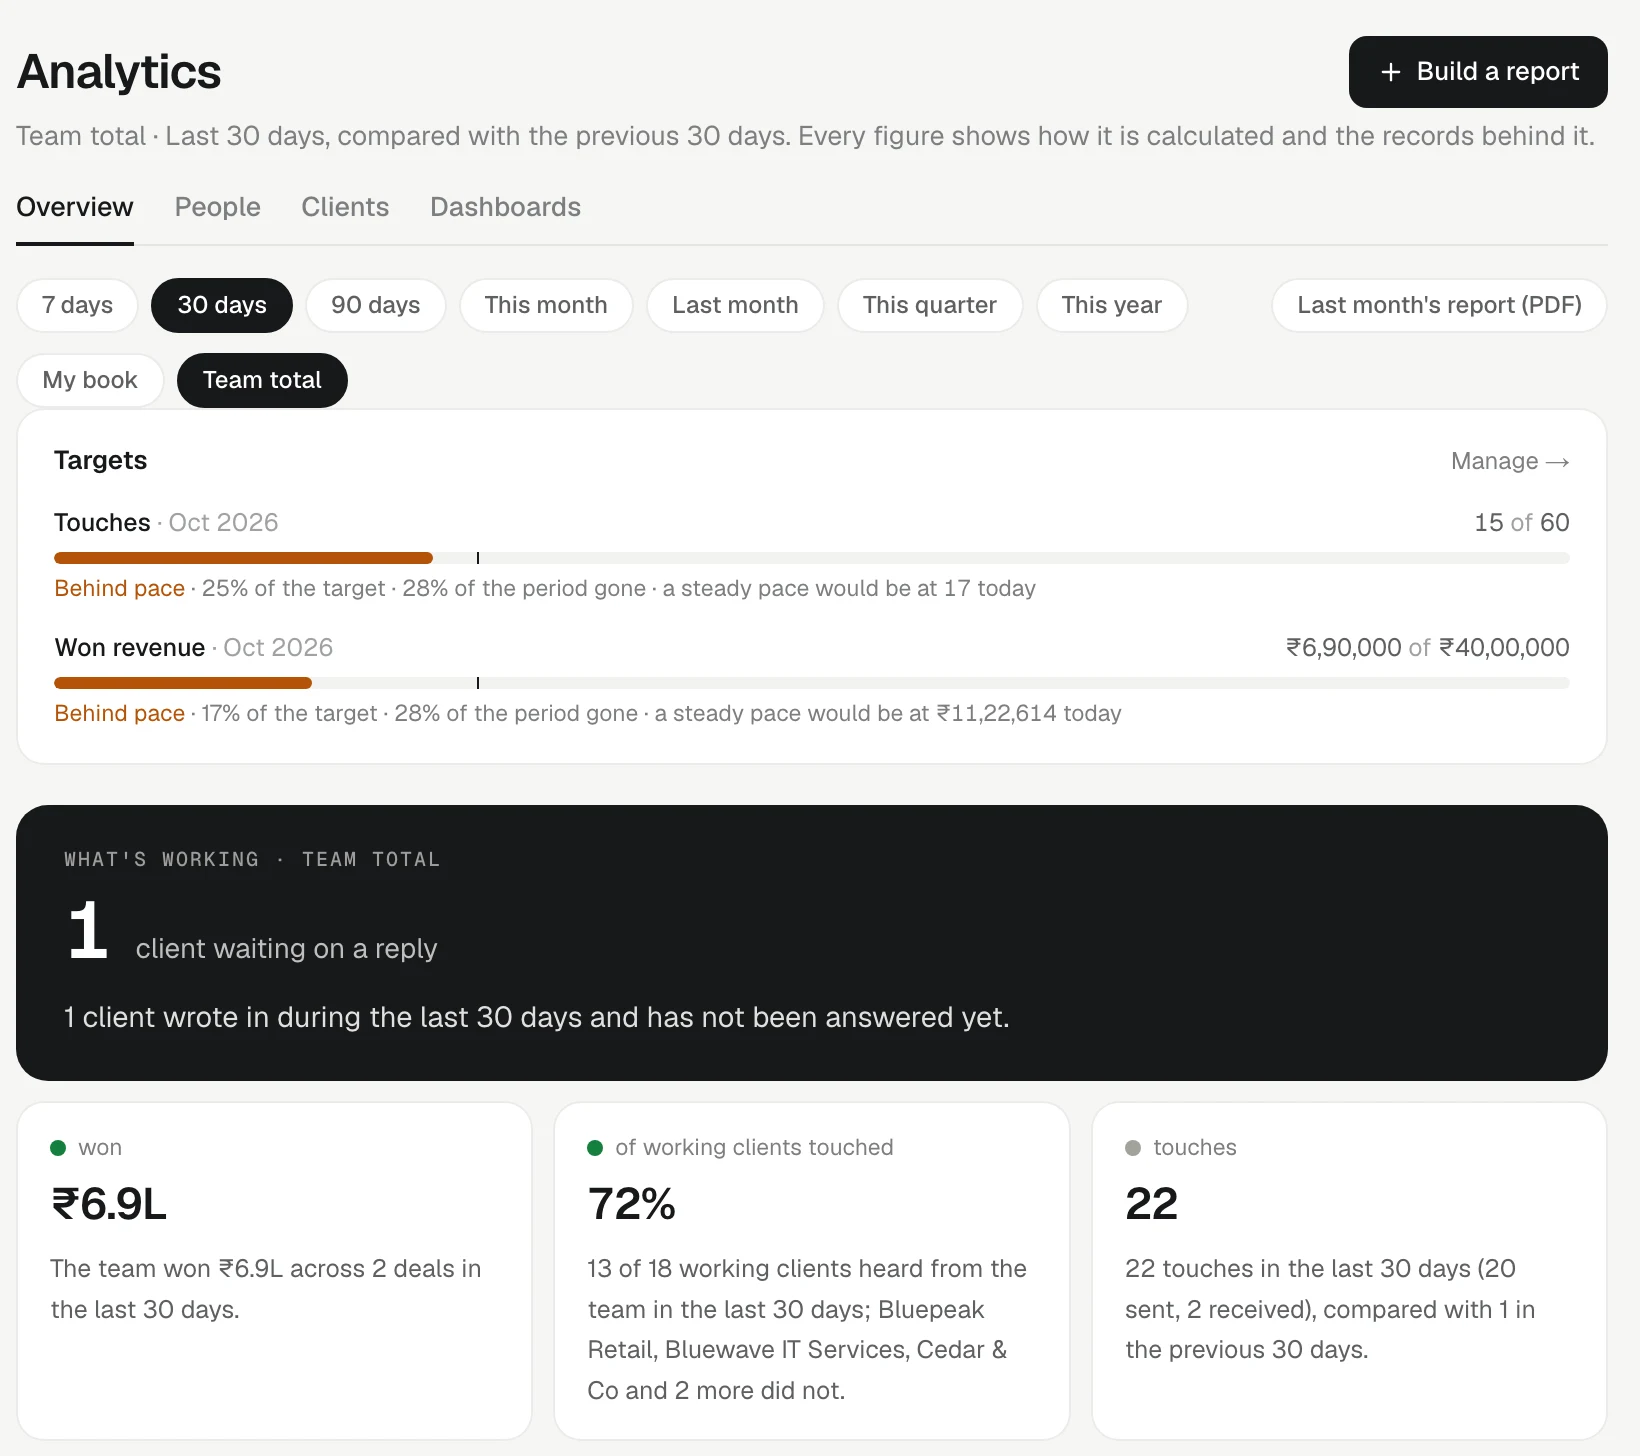
Choose the period and whose numbers
Under the views, two buttons sit side by side. Tap one to pick from its list (on a phone the list rises from the bottom):
- Period — Last 7 days, Last 30 days, Last 90 days, This month, Last month, This quarter or This year. Each figure is compared with the previous period of the same length.
- Whose numbers — Team total or My book (the clients you own and the touches you made). A manager also sees My team: them plus everyone who reports to them. An admin can also pick one teammate.
Your choices are kept in the address bar, so you can bookmark a view or send the link to a teammate. They see it with their own permissions.
Four views
- Overview — the headline story for the period.
- People — one row per teammate, side by side. Admins and managers only.
- Clients — every working client with score, touches, last touch, won and open money, overdue promises and owner, plus lists such as Cooling, Warming, Waiting on us and Never touched.
- Dashboards — saved reports laid out on one screen. See Saved and shared reports.
What the Overview shows
- Targets, when your team has set any. See Targets.
- What's working — a short written read of the period. See What's working.
- Headline numbers — Won revenue, Win rate, Open pipeline, Touches and Promises kept on time, each against the previous period. "On time" means by the day a promise or a task was first due: moving the date later does not turn a late one into an on-time one.
- Revenue — what closed, how the stages convert, and what is still open.
- Activity — touches by channel, clients touched, reply rate and median reply time, plus the clients Not touched this period.
- Relationship health — the same 0–100 score the client list ranks by, over time.
- Promises — what you promised clients and what they promised you.
- Team — each person's numbers. Admins see this on Team total and can click a name to open that person's numbers.
- What's blocking — the objections that keep coming up.
Check any number
Under each chart:
- How this is calculated · table opens the definition and the numbers as a table.
- Download CSV gives you the figures for a spreadsheet.
In the report builder, clicking a number lists the exact records that were counted.
Build your own
Click Build a report at the top right to make any cut of the numbers you need. See Build a report.
Related
- What's working — A short written read of your period at the top of Analytics. The AI writes the sentences; KretaOS counts every number in them.
- How the numbers are counted — The rules behind every figure on Analytics, in reports and in the monthly mail — so the same question always gets the same answer.
- Build a report — Pick a measure, cut it by owner, stage, channel or your own fields, filter it, and open the exact records behind every number.
- The analytics page — Read your numbers on Analytics — pick a period and whose numbers, then open any figure to see how it was counted.
Or write to contact@tamkis.com