The analytics page
Read your numbers on Analytics — pick a period and whose numbers, then open any figure to see how it was counted.
Lesson 1 of 4 5 minUpdated 8 Oct 2026
Everything you log, sync and close in KretaOS adds up somewhere, and Analytics is where you read it. Open it from the left rail. This lesson walks you through the page from top to bottom, so the next lessons can build on it.
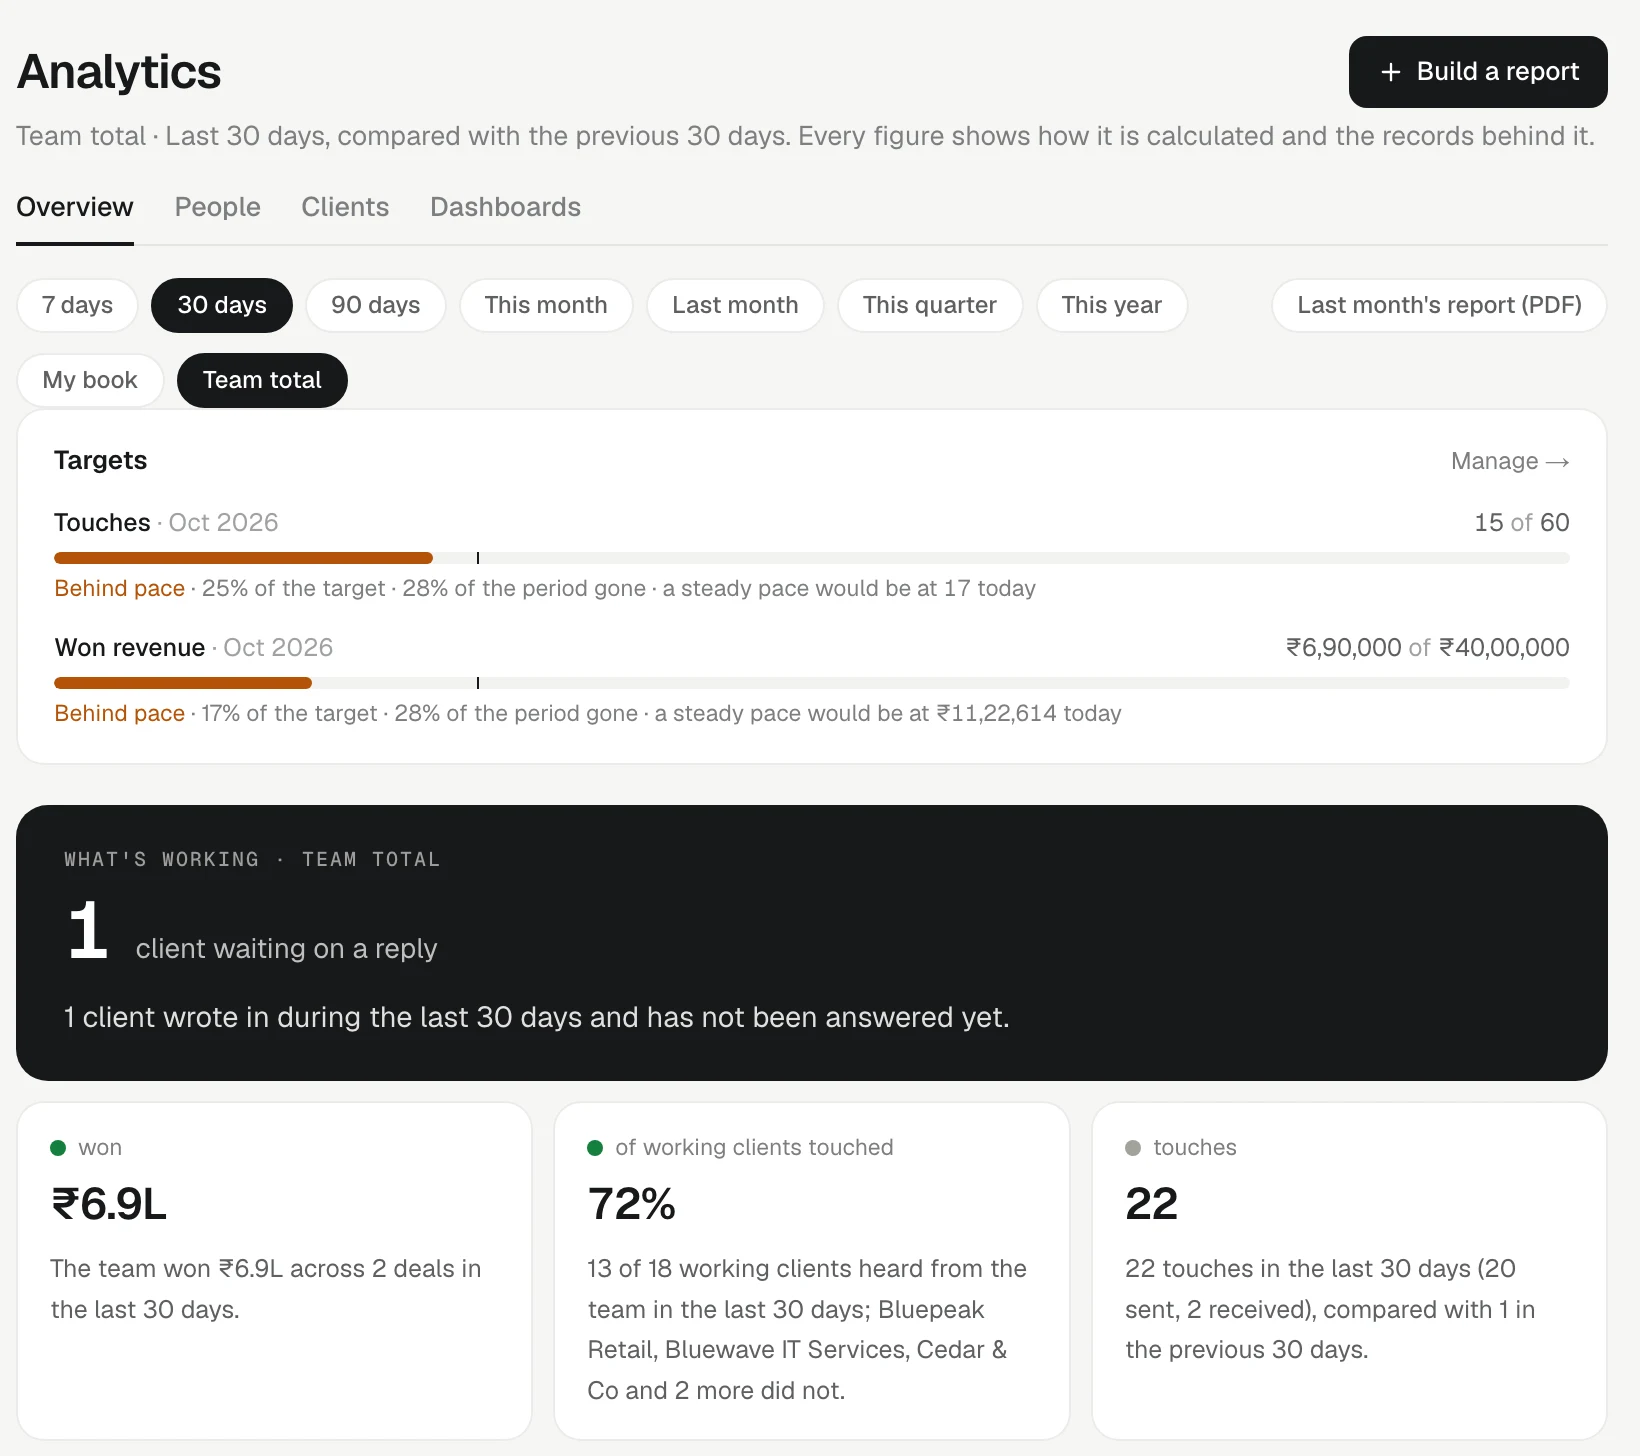
Pick a period and whose numbers
Two rows of chips sit at the top, and every figure on the page follows them.
- Period: 7 days, 30 days, 90 days, This month, Last month, This quarter or This year. Each figure is compared with the period just before it, and the line under the title says which one.
- Whose numbers: My book is the clients you own and the touches you made. Team total is the whole workspace added up. If people report to you, you also see My team: you plus everyone under you.
An admin can also open any one teammate's numbers. A member sees their own book and the team total, never another person's book on its own.
Four views
Under the title you will find Overview, Clients and Dashboards. Admins and managers also see People.
- Overview opens with your Targets, when your team has set any, then What's working: a few short cards on what went well and what needs attention. The sentences are written for you, but every number in them comes from the same counts as the rest of the page. Below that is a strip of headline numbers: Won revenue, Win rate, Open pipeline, Touches and Promises kept on time. After the strip come the sections: Revenue, Activity, Relationship health, Promises and What's blocking.
- Clients lists every working client with its numbers for the period, plus short lists like the clients nobody touched.
- People puts each teammate's numbers side by side, with the team median. It is a set of plain facts, not a single score.
- Dashboards holds the reports you have pinned together. You will build one in the next lesson.
Every number explains itself
Under each chart is a fold called How this is calculated · table. Open it to read the definition in one sentence, with the chart's data as a table. Next to it, Download CSV gives you the same rows as a spreadsheet. Where there is one, a link takes you straight to the clients or deals behind the chart.
A few rules hold everywhere:
- Revenue counts on the day a deal first reaches a won stage, so editing an old deal never counts it twice.
- Money in different currencies is never added together.
- When there are too few cases to make a fair rate, you see a plain count such as "2 of 3" instead of a percentage.
- "Open" and "overdue" mean as of today, and the label says so.
Promises are split in two
The Promises section keeps Ours (what your team promised) apart from Theirs (what clients said they would do). Your on-time rate only ever counts your own promises.
Try it
- Open Analytics and choose This month.
- Switch between My book and Team total, and see how the headline numbers change.
- Under the Revenue chart, open How this is calculated · table and read the definition.
- Press Download CSV on the same chart and open the file.
Or write to contact@tamkis.com