Build a report
Choose a measure, group it, filter it, open the records behind any number — then save it to your Analytics page.
Lesson 2 of 4 6 minUpdated 8 Oct 2026
The analytics page answers the questions most teams ask. When yours is different — "won revenue by lead source, Tier 1 only" — you build a report. A report is a saved question, not a frozen result. Every time anyone opens it, it is counted again from today's data.
Start a report
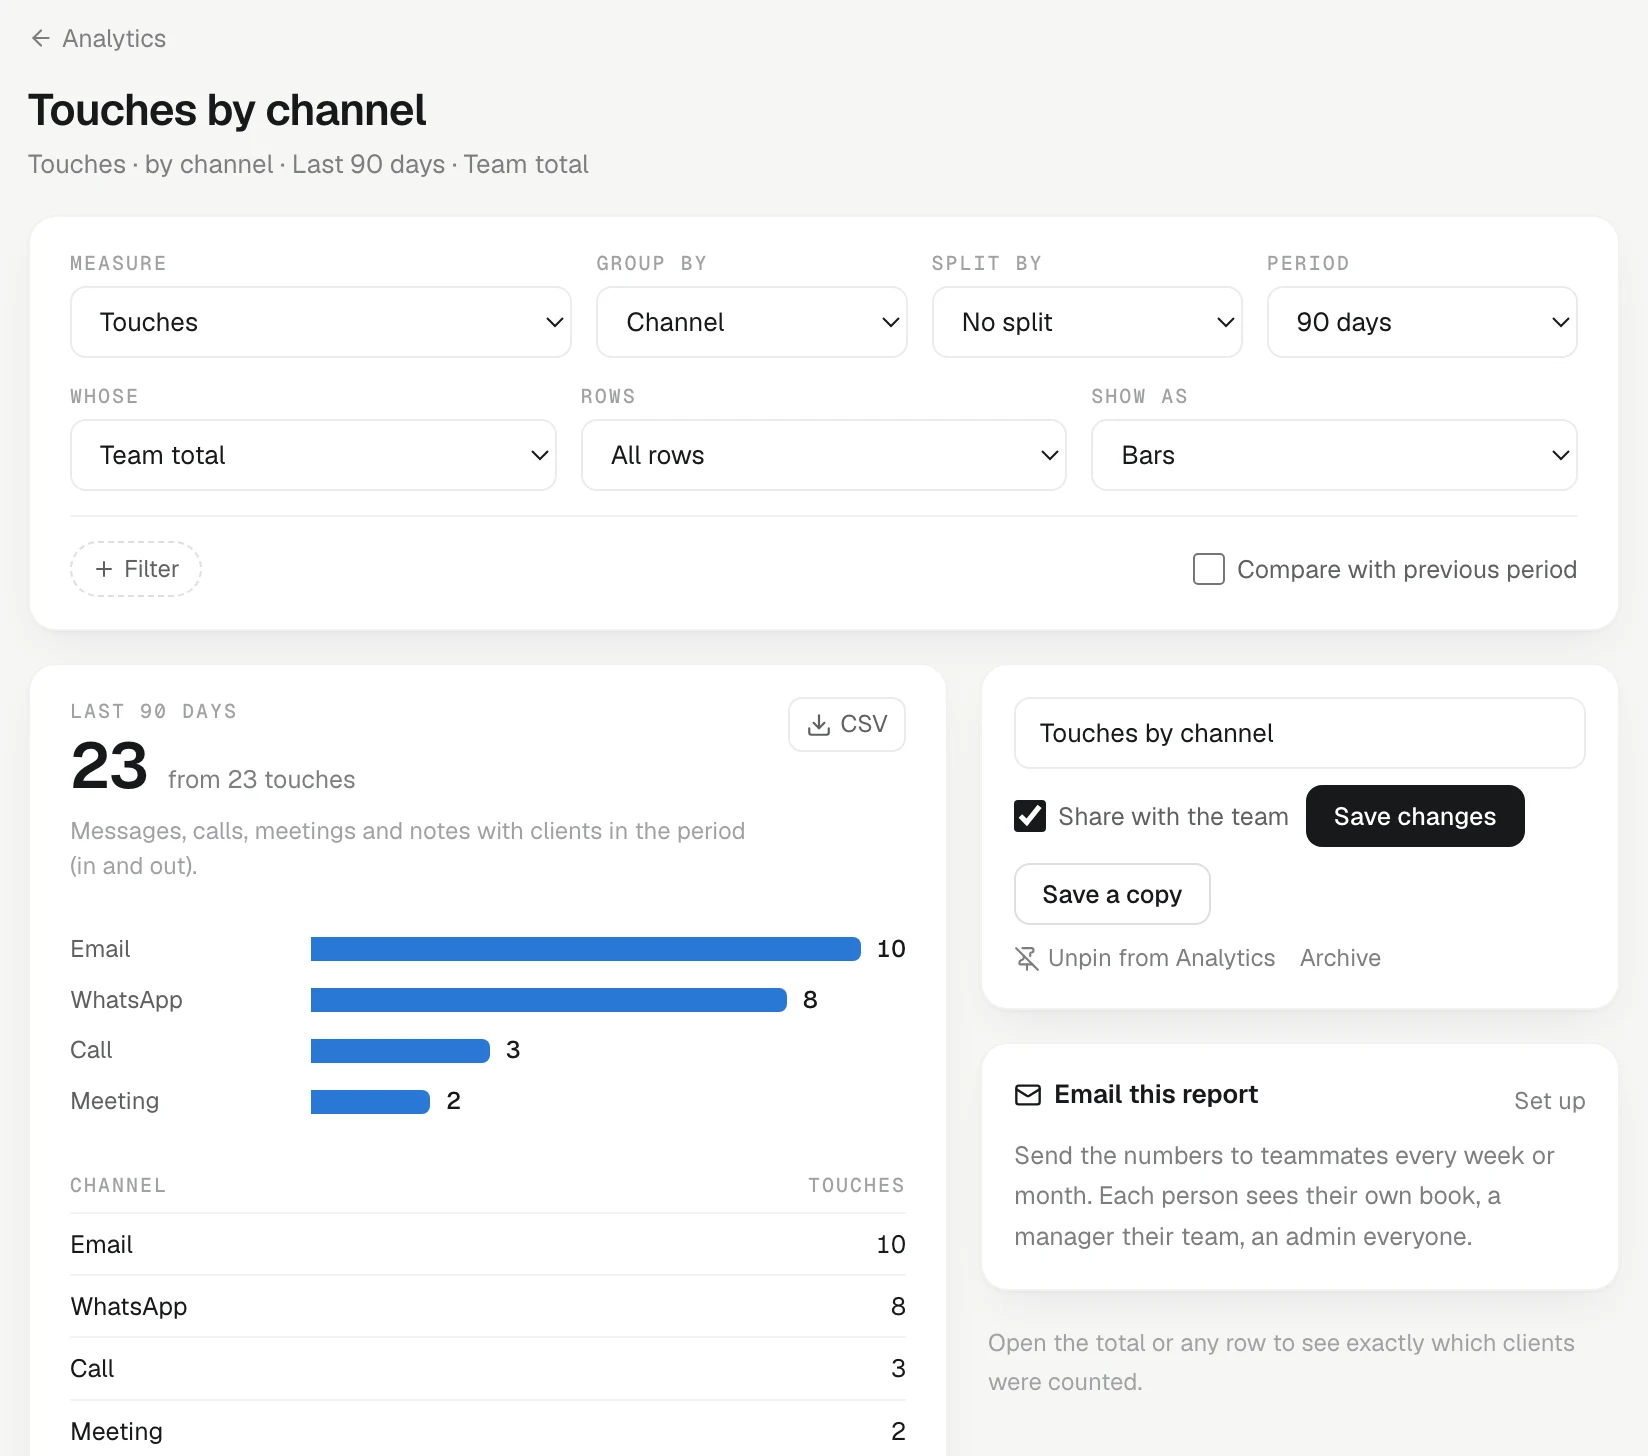
On Analytics, press Build a report. The builder has two rows of choices, and the chart changes as you pick:
- Measure: what you are counting. Measures come in groups: Deals (such as Won revenue, Win rate, Open pipeline value, Sales cycle, Stage conversion), Activity (Touches, Clients touched, Reply rate, Median reply time), Clients, Promises and Tasks.
- Group by: how to break it down. For example Owner, Stage, Channel, Industry, Tier, Lead source, Time, or one of your own custom fields. Choose Nothing (one number) to get a single total.
- Split by: an optional second breakdown, such as won revenue by owner, split by channel.
- Period: for measures that happen over time. Measures like Open deals are always counted as of right now.
- Pipeline, when you have more than one. Whose lets you count your book, your team or the whole team. Rows keeps only the top 5, 10 or 20. Show as picks a number, columns, line, bars, table or funnel.
Tick Compare with previous period to see the change next to each value.
If a measure can't be broken down the way you picked, the builder says so. It never guesses.
Narrow it with filters
Press Add filter, pick a field such as Tier or Industry, and tick the values you want. Filters are applied before anything is counted, so the totals only include what matches. Several values in one filter mean "any of these". Two filters mean "both".
See exactly what was counted
Click the total or any row. A list opens beside the chart with every client, deal or task that was counted in it. Each one links to its page, and These … as CSV downloads the list. The number and the list always match, because both come from the same count.
Save, pin and share
Name the report and press Save report. It is pinned to your Analytics page — under Your reports, or on your dashboard once you have one — and Unpin from Analytics takes it off again. Tick Share with the team to make it visible to teammates. Each of them sees the numbers they are allowed to see.
Only the person who made a report can change it. Anyone else can press Save a copy and change their own copy. When you no longer need a report, you can archive it from the same bar.
To put several saved reports on one screen, open Analytics › Dashboards and press New dashboard.
Try it
- Open Analytics and press Build a report.
- Set Measure to Touches, Group by to Channel, and Period to 30 days.
- Click the biggest row and look through the list of what was counted.
- Name the report and press Save report, then go back to Analytics and find it there.
Or write to contact@tamkis.com