Build a report
Pick a measure, cut it by owner, stage, channel or your own fields, filter it, and open the exact records behind every number.
Updated 8 Oct 2026
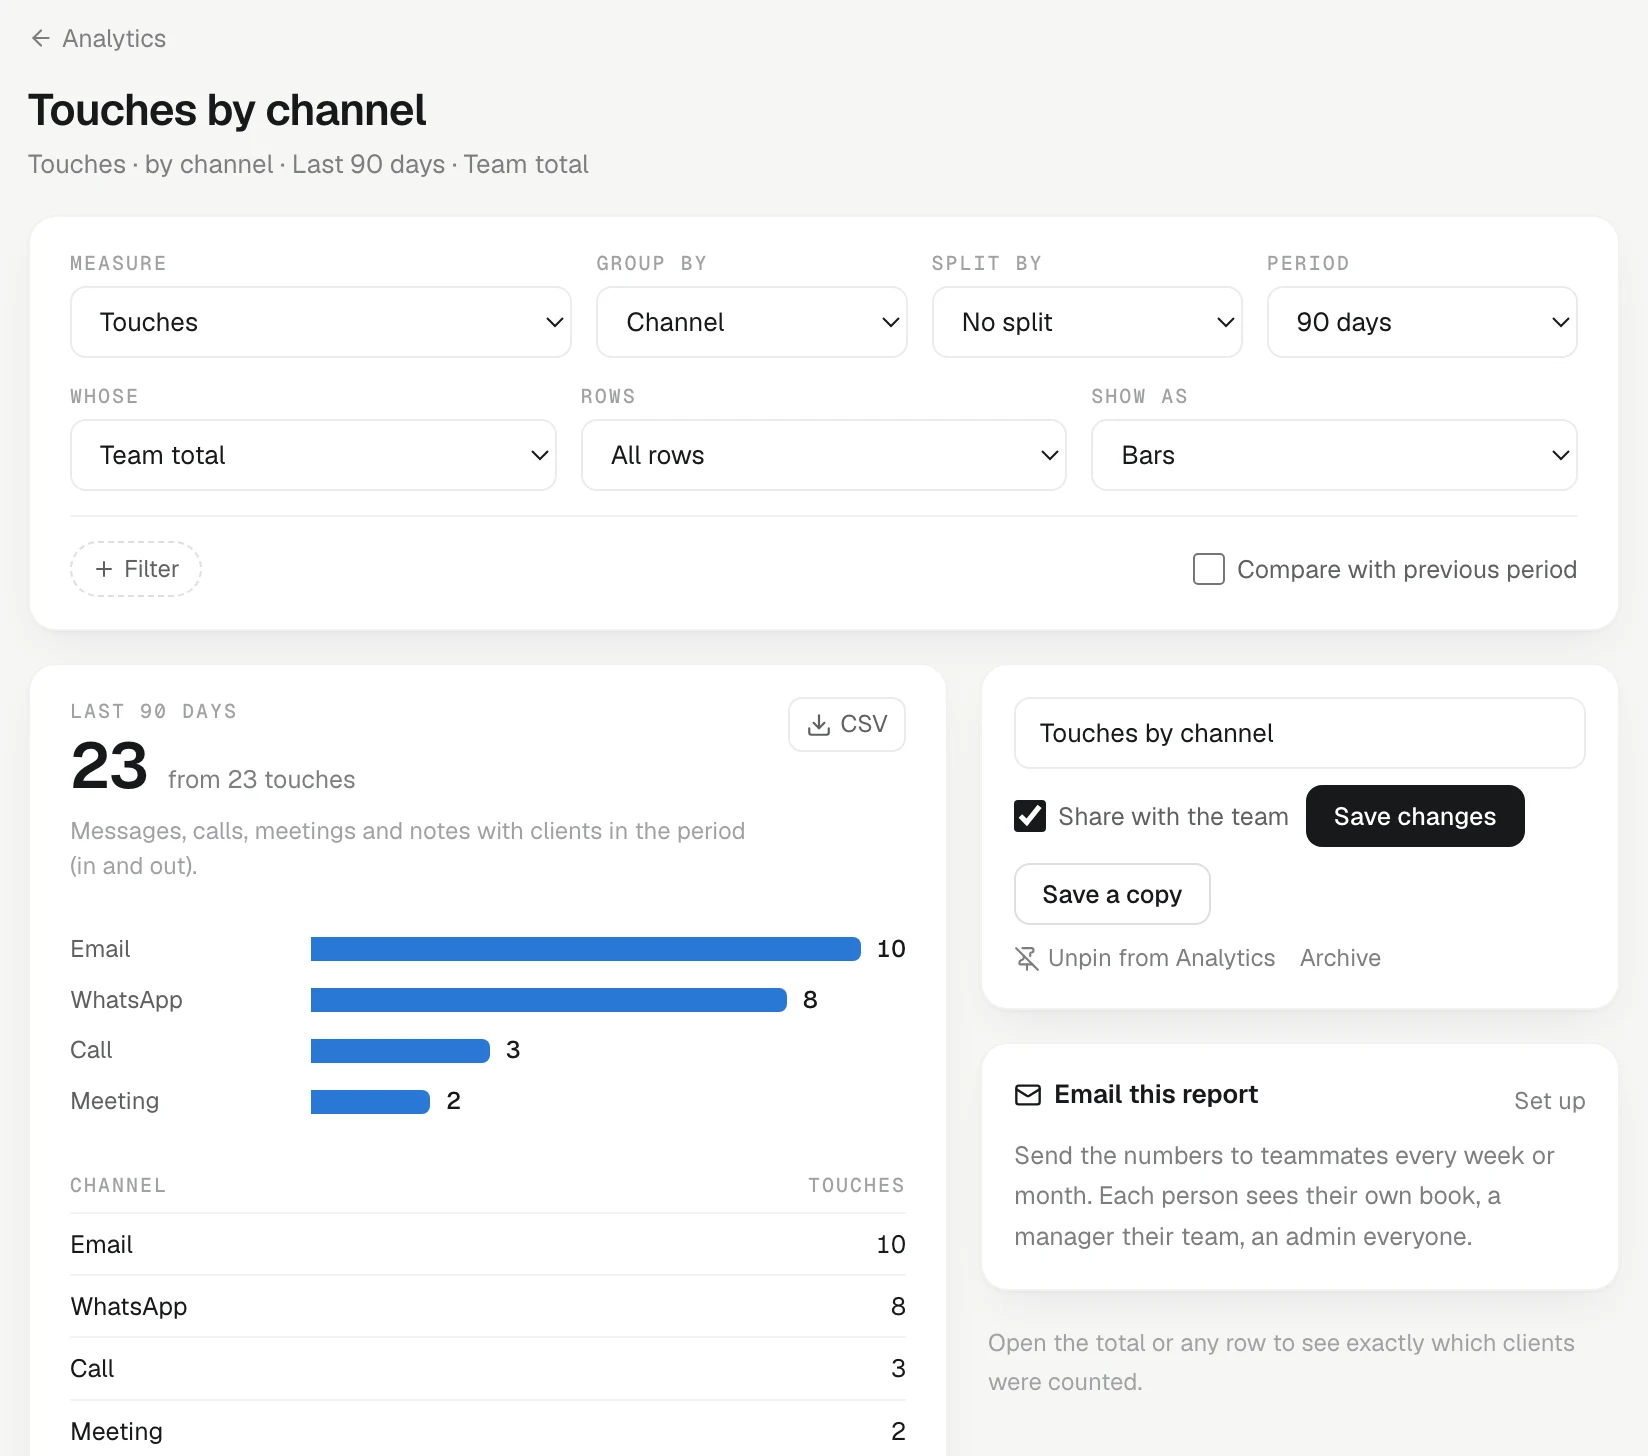
The report builder answers the questions the fixed Analytics page does not — "win rate by lead source for Tier 1 clients this quarter", or "touches by owner, split by channel". You choose what to count and how to cut it, and KretaOS draws it.
Open the builder
On Analytics, click Build a report, or New report under Your reports.
Choose what to count
- Measure — what you want counted. For example Won revenue, Deals won, Win rate, Open pipeline value, Sales cycle, Time in stage, Stage conversion, Pipeline created, Touches, Clients touched, Reply rate, Median reply time, Promises kept, Promises kept on time, Quiet clients, Tasks done, Tasks overdue, Relationship score and Records added.
- Group by — how to cut it: Time, Owner, Pipeline, Stage, Channel, Client kind, Industry, City / region, Tier, Lead source, A client field or A deal field. Choose Nothing (one number) for a single figure. With Time, Every sets the step (day, week, month and so on).
- Period — the stretch of time, the same choices as the Analytics page.
- Whose — your book, your team or the whole workspace, as your role allows.
- Pipeline — All pipelines, or one of yours.
- Show as — Number, Columns, Line, Bars, Table or Funnel, depending on the measure.
Every measure shows a one-line definition under the result, such as "Won ÷ (won + lost), for deals closed in the period."
Narrow it down
- Filter — up to four filters, for example Owner is Asha or Ravi, and Tier is 1. Values inside one filter are "either"; separate filters must all match. The values offered come from your own data.
- Split by — a second category drawn as stacked series, for example touches by owner split by channel. Up to eight series; the rest are grouped as Others.
- Rows — All rows, or the Top 5, Top 10 or Top 20.
- Compare with previous period — adds the period before, so you can see the change.
If a measure cannot be cut a certain way, the builder says so in a sentence instead of drawing something misleading.
See the records behind a number
Click the big total to open Everything counted, or click any row to see exactly which deals, clients or tasks went into it. The list is the same set that was counted — nothing more, nothing less.
CSV downloads the figures. From a drill-down list you can download those records too.
Ask for it instead
You can ask Ask AI for the same report: "Win rate by lead source this quarter for Tier 1 — save it as Tier 1 funnel." It shows the chart in the conversation and, when you ask, saves it to your Analytics page.
Related
- Saved and shared reports — Save a report as a link that always shows today's numbers, pin it to Analytics, share it with the team, and arrange reports on dashboards.
- How the numbers are counted — The rules behind every figure on Analytics, in reports and in the monthly mail — so the same question always gets the same answer.
- Custom fields — Add the details your team tracks that KretaOS does not have yet, such as a GSTIN, a city or a renewal date, on clients, people and deals.
- Build a report — Choose a measure, group it, filter it, open the records behind any number — then save it to your Analytics page.
Or write to contact@tamkis.com